Tracking Performance and Managing Risk: Enhancing a Virtual Stock Portfolio with Trailing Stop Loss and Risk Assessment
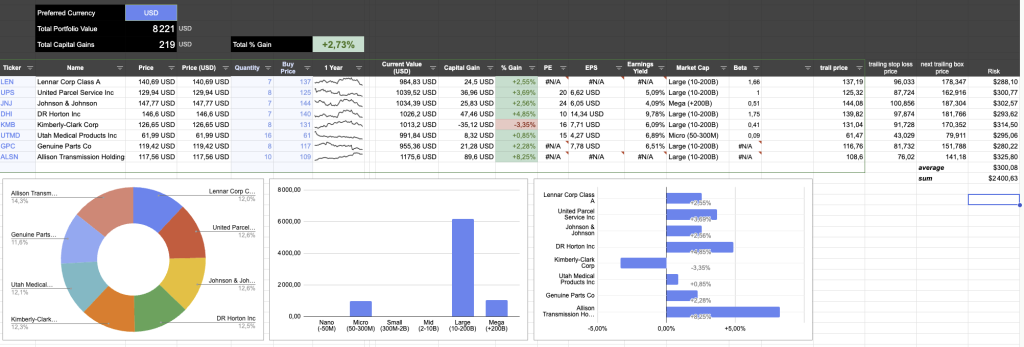
In my previous blog post, I created a virtual stock portfolio using Joel Greenblatt’s Magic Formula. To follow up on the performance of this portfolio, I developed a Google Sheet to track and analyze its progress.

Portfolio Performance Update
As of now, the portfolio has achieved a performance of +2.73% after just two weeks. While this shows promise, it’s important to note that a two-week timeframe is far too short to draw any meaningful conclusions. Among the stocks in the portfolio, the standout performer is Allison Transmission Holdings (ALSN) with an impressive gain of +8.25%. On the flip side, Kimberly-Clark Corporation (KMB) has underperformed, with a loss of -3.35%.
Introducing Two New Concepts: Trailing Stop Loss and Risk
To enhance the management and tracking of the portfolio, I’ve incorporated two additional features into the Google Sheet:
1. Trailing Stop Loss
The trailing stop loss is a tool designed to minimize emotional decision-making during trading. It has two key components:
- Stop Loss: A predefined threshold to cut losses and sell a stock if its price falls below a certain percentage.
- Trailing: Adjusts the stop loss limit upwards as the stock price increases, enabling you to lock in gains while limiting potential losses.
Here’s an example: For ALSN, the current trailing stop loss ranges from $76 (low end) to $141 (high end). If the stock price rises above $141, the trailing stop loss will be recalculated to 30% below the new price. For instance, if the stock reaches $150, the new stop loss limit would be $105 (i.e., 30% below $150).
Since this is a virtual portfolio, I’m simulating the trailing stop loss in the Google Sheet. I’ve set a trailing stop loss of 30% and will manually update positions if a limit is reached. In a real-world scenario, most trading platforms allow you to configure this feature automatically.
2. Risk Calculation
Understanding risk is crucial for informed decision-making. With the trailing stop loss in place, we can estimate the maximum potential loss for each stock and the portfolio as a whole. Here’s how I calculate risk:
- Individual Stock Risk: The difference between the purchase price and the stop loss price. This represents the maximum theoretical loss per stock.
- Portfolio Risk: The total risk is the sum of the individual risks for all stocks in the portfolio. Since I’ve evenly distributed investments across the portfolio and set a 30% trailing stop loss, the overall portfolio risk is approximately 30% of the total investment.
As stock prices rise and the trailing limits adjust upward, the risk for individual stocks decreases. This dynamic risk adjustment provides a clearer picture of potential losses and allows for better portfolio management.
Practical Applications
How can we use these insights to optimize our portfolio?
- Adding New Positions: When considering a new investment, the risk calculation helps assess its impact on the total portfolio. For instance, you can evaluate how the new position’s stop loss limit would align with your risk tolerance.
- Replacing Positions: If you plan to replace an underperforming stock, understanding the current portfolio risk enables more informed decisions. Setting an appropriate trailing stop loss for the new stock ensures the portfolio remains balanced and aligns with your overall risk strategy.
By combining the Magic Formula with these additional tools, this approach provides a structured framework for managing and optimizing a stock portfolio. The Google Sheet not only tracks performance but also supports data-driven decision-making to minimize losses and capitalize on gains.
Stay tuned for future updates as we monitor the portfolio’s progress and refine these strategies further!


